Interface 06

Reading the History Strip Honestly

Play colour rounds

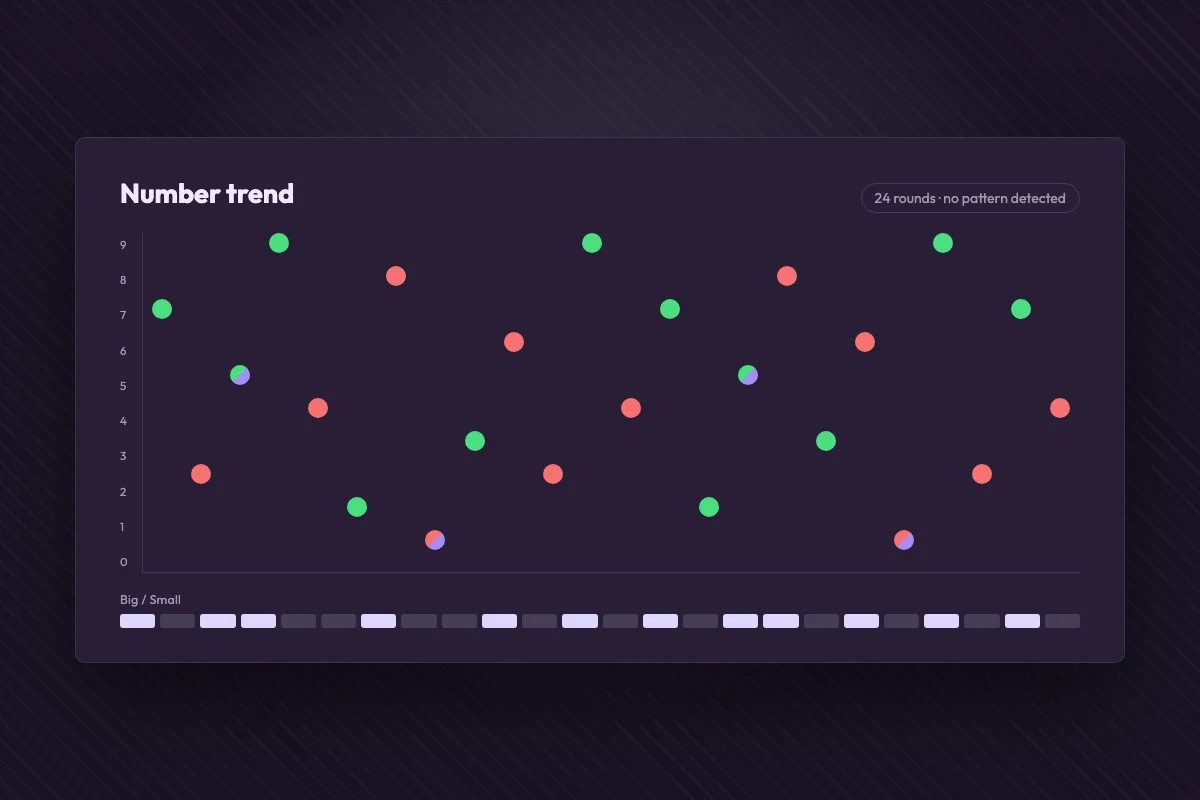
The strip of past results is the most-watched element in these apps and the only one built entirely from real data. That is exactly what makes it persuasive — and it contains no information about the next round.

Realevery digit shown
0forecasting value
2opposite readings
What it contains

Three Genuine Things and One Decoration

The data is accurate. The interpretation drawn on top of it is where the claim happens.

Real Real

The result column

Every settled digit in order, checkable against the operator's own history. The one part of these interfaces we have never found to be wrong.

Real Real

Period numbers

Round identifiers, sequential and verifiable. They confirm no rounds are missing from the strip, which is worth knowing.

Decorative Decorative

Trend lines and pattern labels

Names applied to shapes after they have appeared, and lines extended forward as a graphic choice rather than a calculation.

The contradiction test

Show five reds to a room and half will call red for continuation and half will call green for correction. Same data, opposite conclusions, and both delivered with confidence.

That is how you know the strip is telling nobody anything: if it carried information, the readings would agree.

Runs

How Long Streaks Actually Get

Approximate likelihood of seeing at least one run of that length in a hundred rounds. Blocks are out of ten.

A run of fiveEffectively guaranteed
~97%
A run of sevenMore often than not
~55%
A run of tenUncommon, not remarkable
~9%
The next round continuing any runUnchanged by the run's length
50%
The column test

A Two-Minute Check on Any Trend Grid

Run it once and the grid stops being persuasive permanently.

Screenshot the grid

Note every pattern the app highlights at the default width.

Step 1

Change the column width

Or copy the same sequence into a spreadsheet with a different number of columns.

Step 2

Look again

The shapes will have moved, dissolved and reformed from identical data.

Step 3

Write it as one line

B and S, or R and G, in a single row. The patterns become far harder to see and nothing has changed.

Step 4
A better use

Four Things Worth Plotting Instead

Charts are not the problem; forecasting from result history is. None of these is offered by the apps.

Cumulative turnover. Total staked across the session, which is the number the operator's share is applied to. It rises faster than most players expect.

Balance against time. A simple line every ten minutes makes the shape of a session visible — particularly the deposit points, which memory smooths over.

Stake size over the session. Plotted against time, this exposes chasing more clearly than any warning message could.

Rounds played per hour. Multiply by average stake and the edge to get the hourly cost of the way you are currently playing.

Why This Element Is So Believable

Because the foundation is real. Nothing in the result column is invented, and a user who checks a few period numbers against the operator's history finds that everything matches. That verified accuracy then transfers, without anybody noticing the step, to the lines and labels drawn on top of it — and those are the only part making a claim.

It is the same move a weather graphic makes, except that a weather model has physics linking yesterday to tomorrow. Here the link is missing and the graphic is doing all the work of implying one.

The Chart We Would Trust

One that plots what you staked rather than what the generator produced. Every genuinely useful number in this game is about your own behaviour, and all of them are available without any tool at all.

Why the sequence contains nothing to extrapolate from is covered on the streaks page, and every guide is on the home page.
FAQ

Is the history data in these apps accurate?

+

Generally yes. The result column is the one element we have consistently found to match the operator's own record — it is the interpretation layered over it that carries the claim.

What is a dragon pattern?

+

A long run of one outcome, named after it has happened. Runs of six or seven are ordinary in a hundred rounds and say nothing about the next one.

Do longer histories reveal clearer patterns?

+

They reveal more shapes, because more data contains more coincidences. What they cannot reveal is a dependency between rounds, since none exists.

Why do patterns change when I resize the grid?

+

Because they are artefacts of the layout. The sequence is identical at any width; the shapes come from how it is wrapped across columns.

Is any chart worth watching during a session?

+

One of your own turnover and stake size. Those two lines describe what the session is costing and whether you are chasing.

Number trend chart plotting the drawn digit across twenty-four consecutive rounds with no repeating pattern

This website is for informational purposes only and is not a gambling operator: we do not accept bets or payments. 18+. Gambling involves risk and may lead to addiction — please gamble responsibly. Information (bonuses/terms/licenses) may change: check current rules on the operator’s website. We are not responsible for decisions and financial losses related to the use of third-party services.